I’m going to provide a series of 10 minute warmers – all of them tried and tested with my learners!
This warmer is called ‘Unusual Statistics’. It can be used with all levels, Business or General English and is materials-free.
Uber-busy teachers can download the lesson plan here or click to download the pdf below.
Unusual-Statistics.pdf (352 downloads)
Procedure
PRE-TASK
- Teacher asks
When you see statistics in a newspaper or magazine, what do they look like?
Elicit bar chart, pie chart.
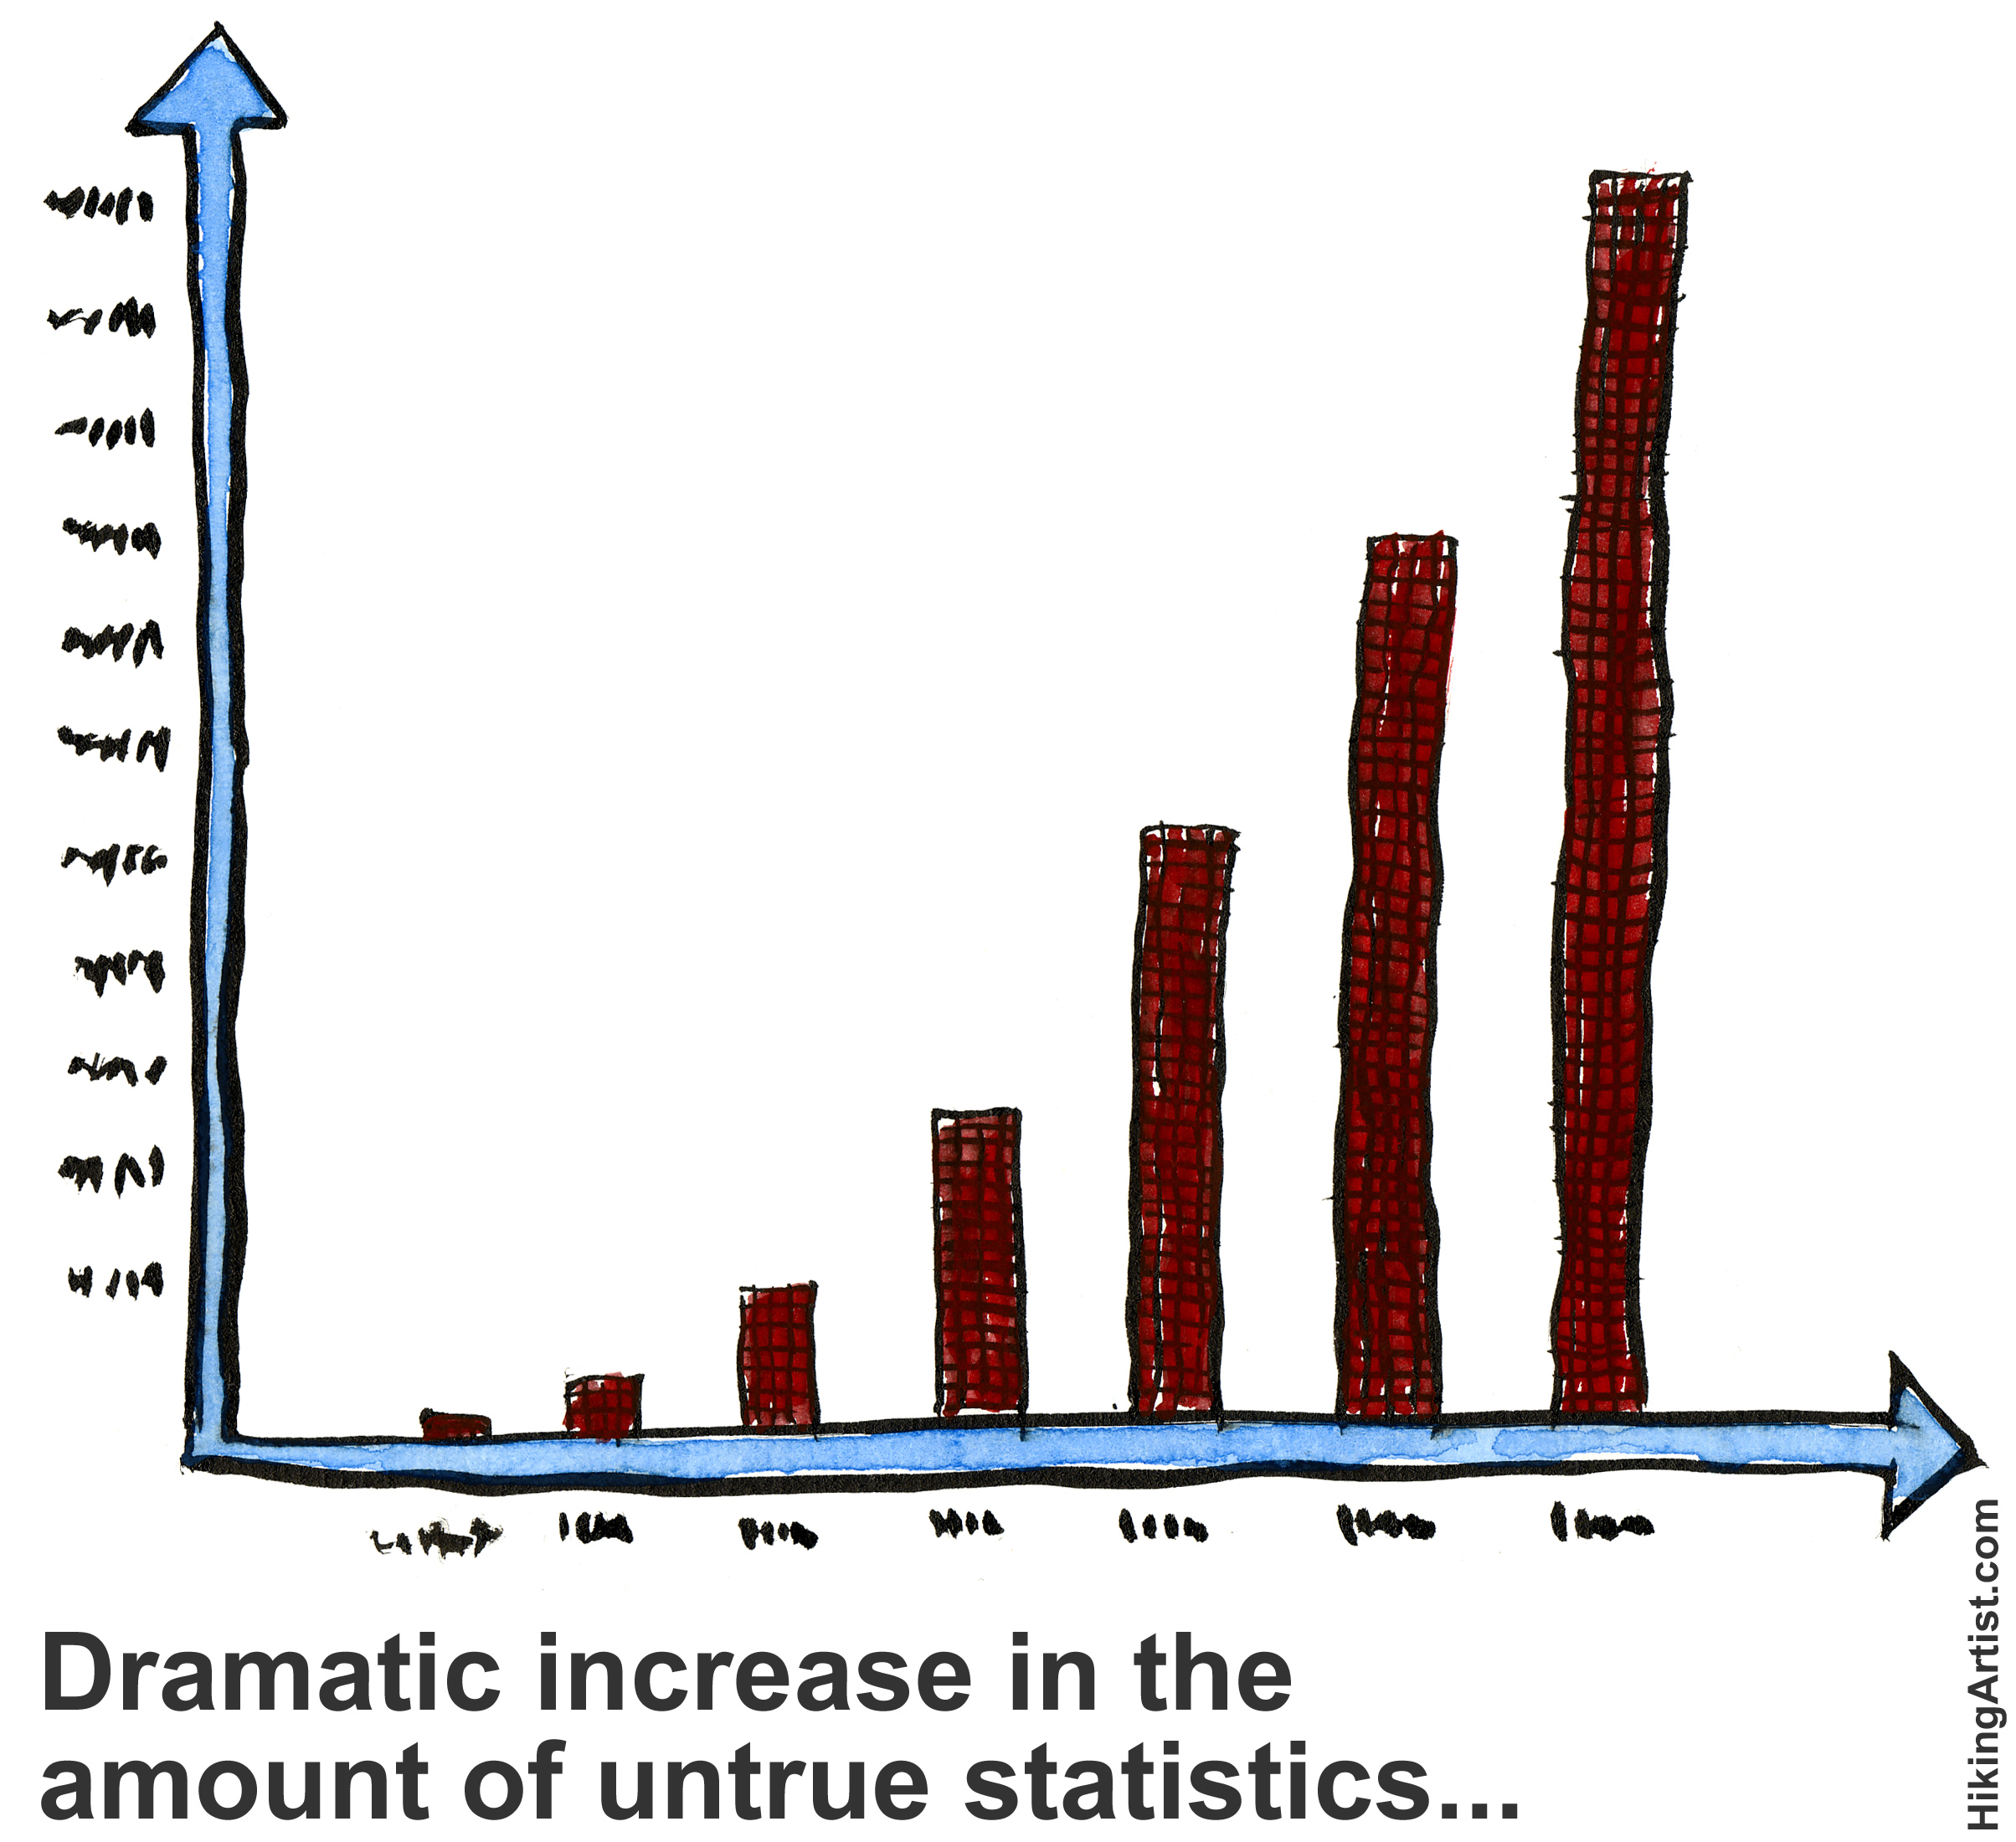
- Teacher draws an unusual statistic on the flip chart or whiteboard (no words!).
-
Learners then have to ask questions about this unusual statistic, to discover what it means. Depending on your learners, you might want to pre-teach the following vocabulary here:
X axis/ Y axis
Is it connected with….? Is it to do with….? Does it have anything to do with…?
What does the first line/ bar represent?
Can I/ we have a clue?
- The learners eventually guess the meaning of the statistic, or the teacher tells them.
TASK
- Teacher tells learners
Now I want you to create your own unusual statistic. You will work in teams but please keep your statistic a secret.
The format to follow is:
– Talk about some interesting facts and figures related to work, or private life
– Decide on some facts or figures that might, or might not be related
– Make an ‘Unusual statistic’ using a bar or pie chart (draw this in your notebooks)*
*Teacher can also give examples here: The time people spend on…..
The money people spend on…..
- Learners then come to front of the class and draw their ‘Unusual statistic’ on the WB/ flipchart. They can then sit down, or stay at the board to answer questions from the class.
- The other group/s of learners have to guess the meaning of the ‘Unusual statistic’ and what the x/y axes mean. For example, is it connected with your private life?
- Repeat until all the groups in the class have shown their ‘Unusual Statistic’.
POST-TASK
- Vote on the best/ most interesting/ most difficult ‘Unusual Statistic’!
Variation
The most important variation would just involve personalising the ‘Unusual statistic’ for your learners. For example, if you teach children one of the graphs could be ‘things we enjoy at school’, ‘food we like to eat’ and so on. For Business English, one of the graphs could be ‘time spent working’ or ‘time spent not working (at work)’.
Follow up
For homework get the learners to come up with examples of ‘Unusual statistics’ from their private lives, or their lives as learners of English e.g. ‘things that really help me learn English’.
If you use this activity – let me know how it goes! And if you like the website, it would be great if you could follow this blog and/or complete this 1 minute survey,
Thanx!
Paul


hi paul
nice warmer thank you
have u seen recent onion on stats?
http://www.theonion.com/articles/study-finds-79-of-statistics-now-sobering,36731/
some very nice language in that to exploit
ta
mura
Hi mura,
love the onion!